
Deciding what to build next
The impact-effort grid, value and effort broken into their parts, and RICE scored through a real example — plus the three ways scoring goes wrong, all of which I have caused.
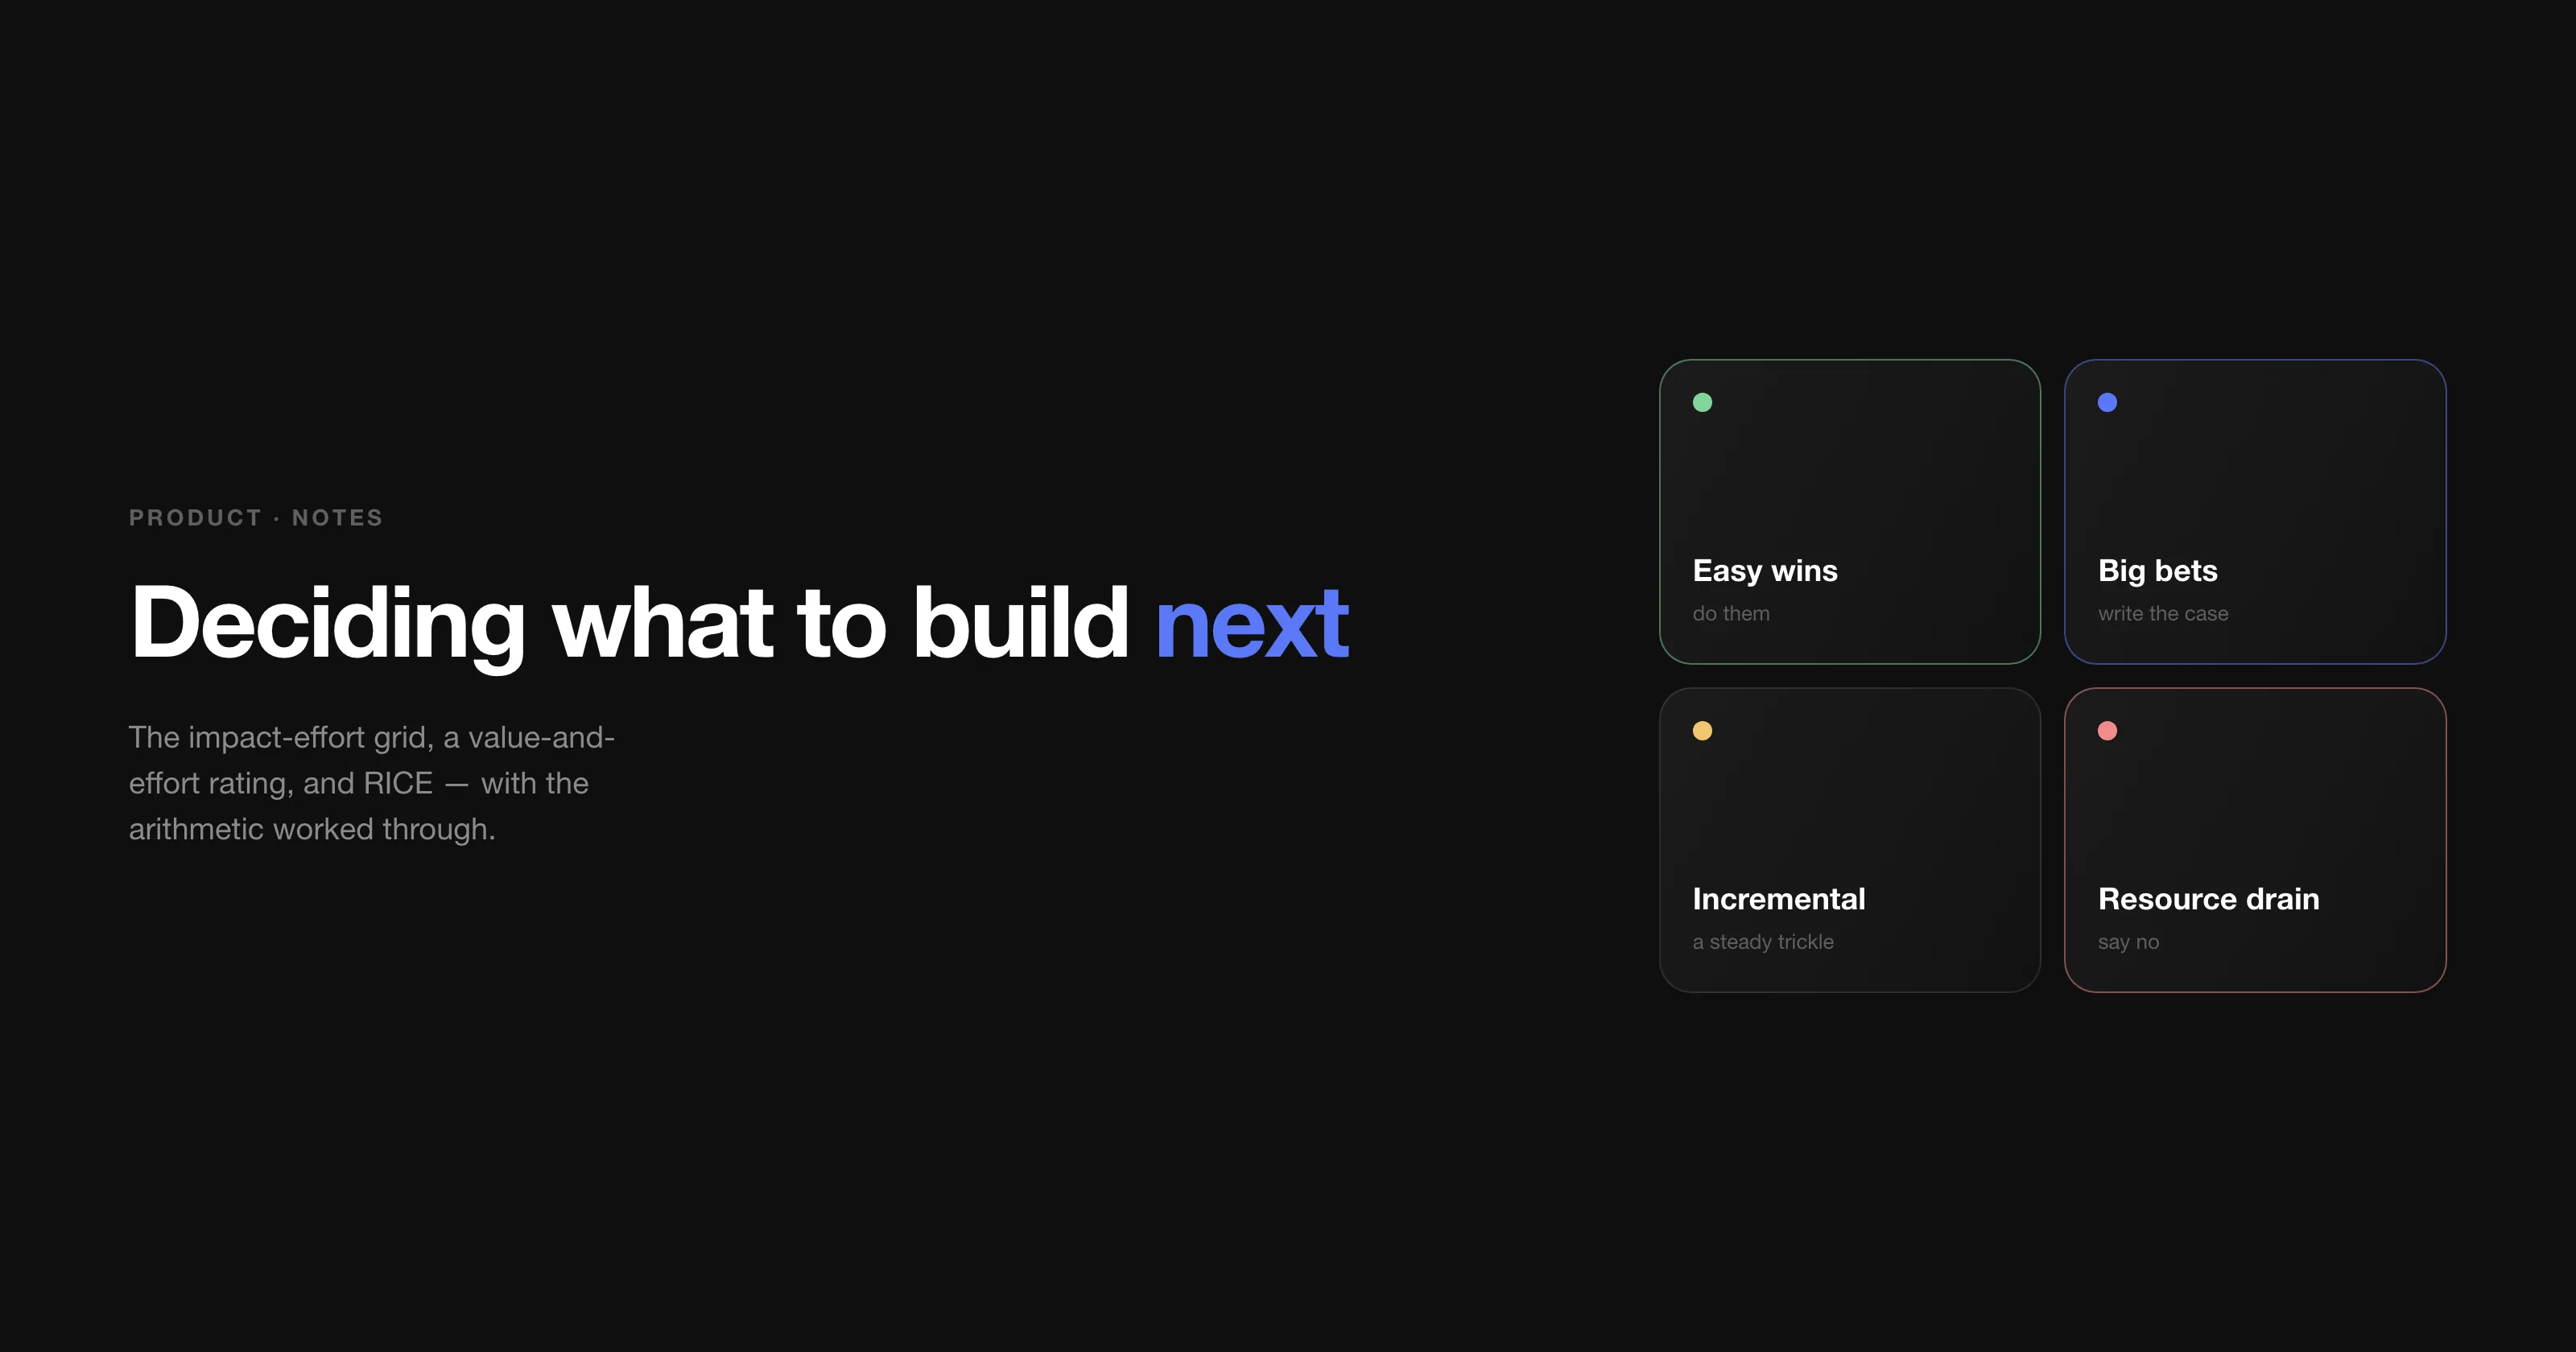
Collecting ideas is the easy half. If you keep all four doors open — employees, metrics, users, clients — the backlog fills up within a month, and then the real problem starts: everything on the list is somebody's good idea, and you can build perhaps a tenth of it.
These are the three tools I actually use for that, from a note I made while planning a roadmap in 2023. None of them makes the decision. What they do is make the argument shorter and harder to win by volume.
1. The grid, for sorting the kind of argument
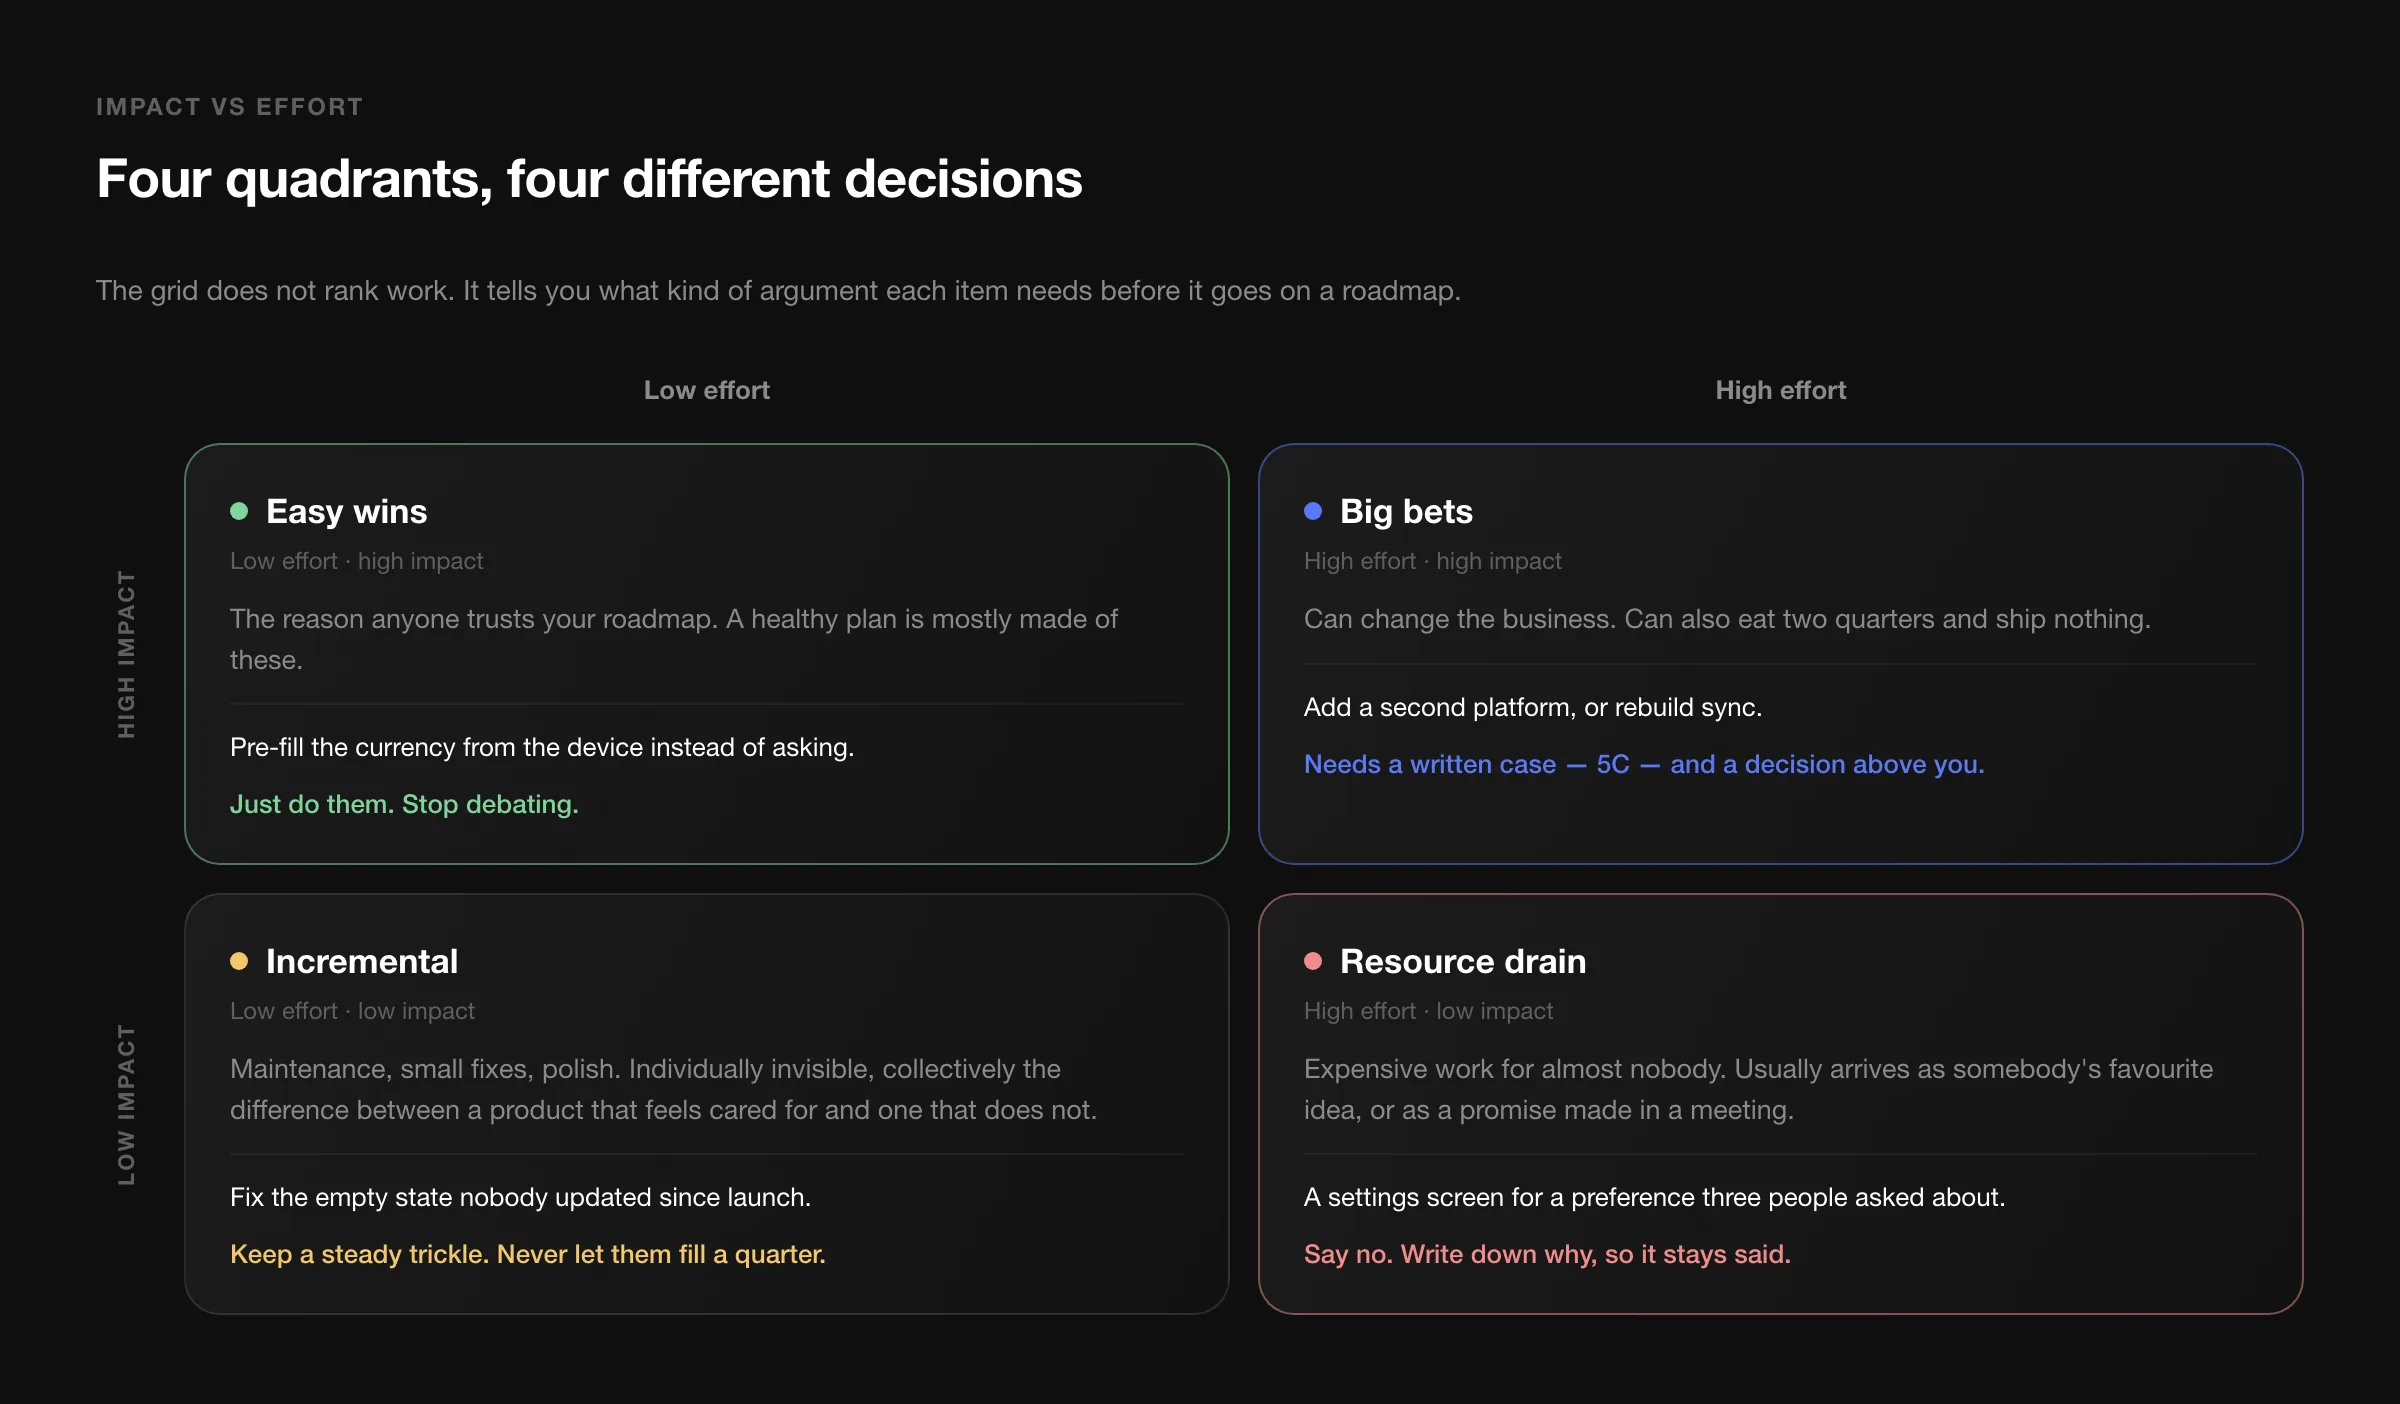
Plot impact against effort and you get four kinds of work, and each one deserves a different conversation.
Easy wins — low effort, high impact — should make up a decent share of any roadmap. They are also the ones most often lost to debate: an item that takes two days does not need a meeting, it needs doing.
Big bets — high effort, high impact — are where products change shape, and where quarters disappear. The rule from my note is a good one: a big bet needs a written case and a decision from above you, not a slot in the sprint board.
Incremental — low effort, low impact — is maintenance, small fixes, polish. Individually invisible, collectively the difference between a product that feels cared for and one that feels abandoned. Keep a steady trickle; never let it fill a quarter.
Resource drain — high effort, low impact — is the quadrant everyone agrees to avoid and nobody actually avoids, because these items rarely arrive labelled. They arrive as a promise made in a sales call, or as the feature somebody senior has wanted for a year. Say no, and write down why, so that it stays said when the question comes back in six weeks.
The honest weakness of this grid: both axes are guesses when you draw it. It is a sorting tool, not a measurement. Which is why the next two exist.
2. Value and effort, broken into their parts
"Impact" and "effort" are each hiding several different questions, and a team that argues about the summary is really disagreeing about one of the parts without naming it.
| Value — how important is it? | Effort — how hard is it? |
|---|---|
| Potential revenue | Cost |
| Benefit to current customers | Development effort |
| Benefit to potential customers | Operational effort — who runs it after launch |
| Contribution to business goals | Implementation effort — migration, support, docs |
| Contribution to strategic goals | Risk, and complexity added to the product |
Rating each item one to five on both halves takes an afternoon for a backlog of thirty, and most of the value appears while you do it. When two people give the same item a 2 and a 5, the interesting part is never the average — it is that one of them was thinking about revenue and the other about the support load.
The three rows people habitually forget are on the right: operational effort, implementation effort, and complexity. A feature that takes a week to build and then needs somebody to check a queue every morning is not a one-week feature. Complexity in particular is a cost you pay on everything you build afterwards.
3. RICE, when you need a number
When the list is long and opinions are loud, I score with RICE. Reach times impact times confidence, divided by effort.
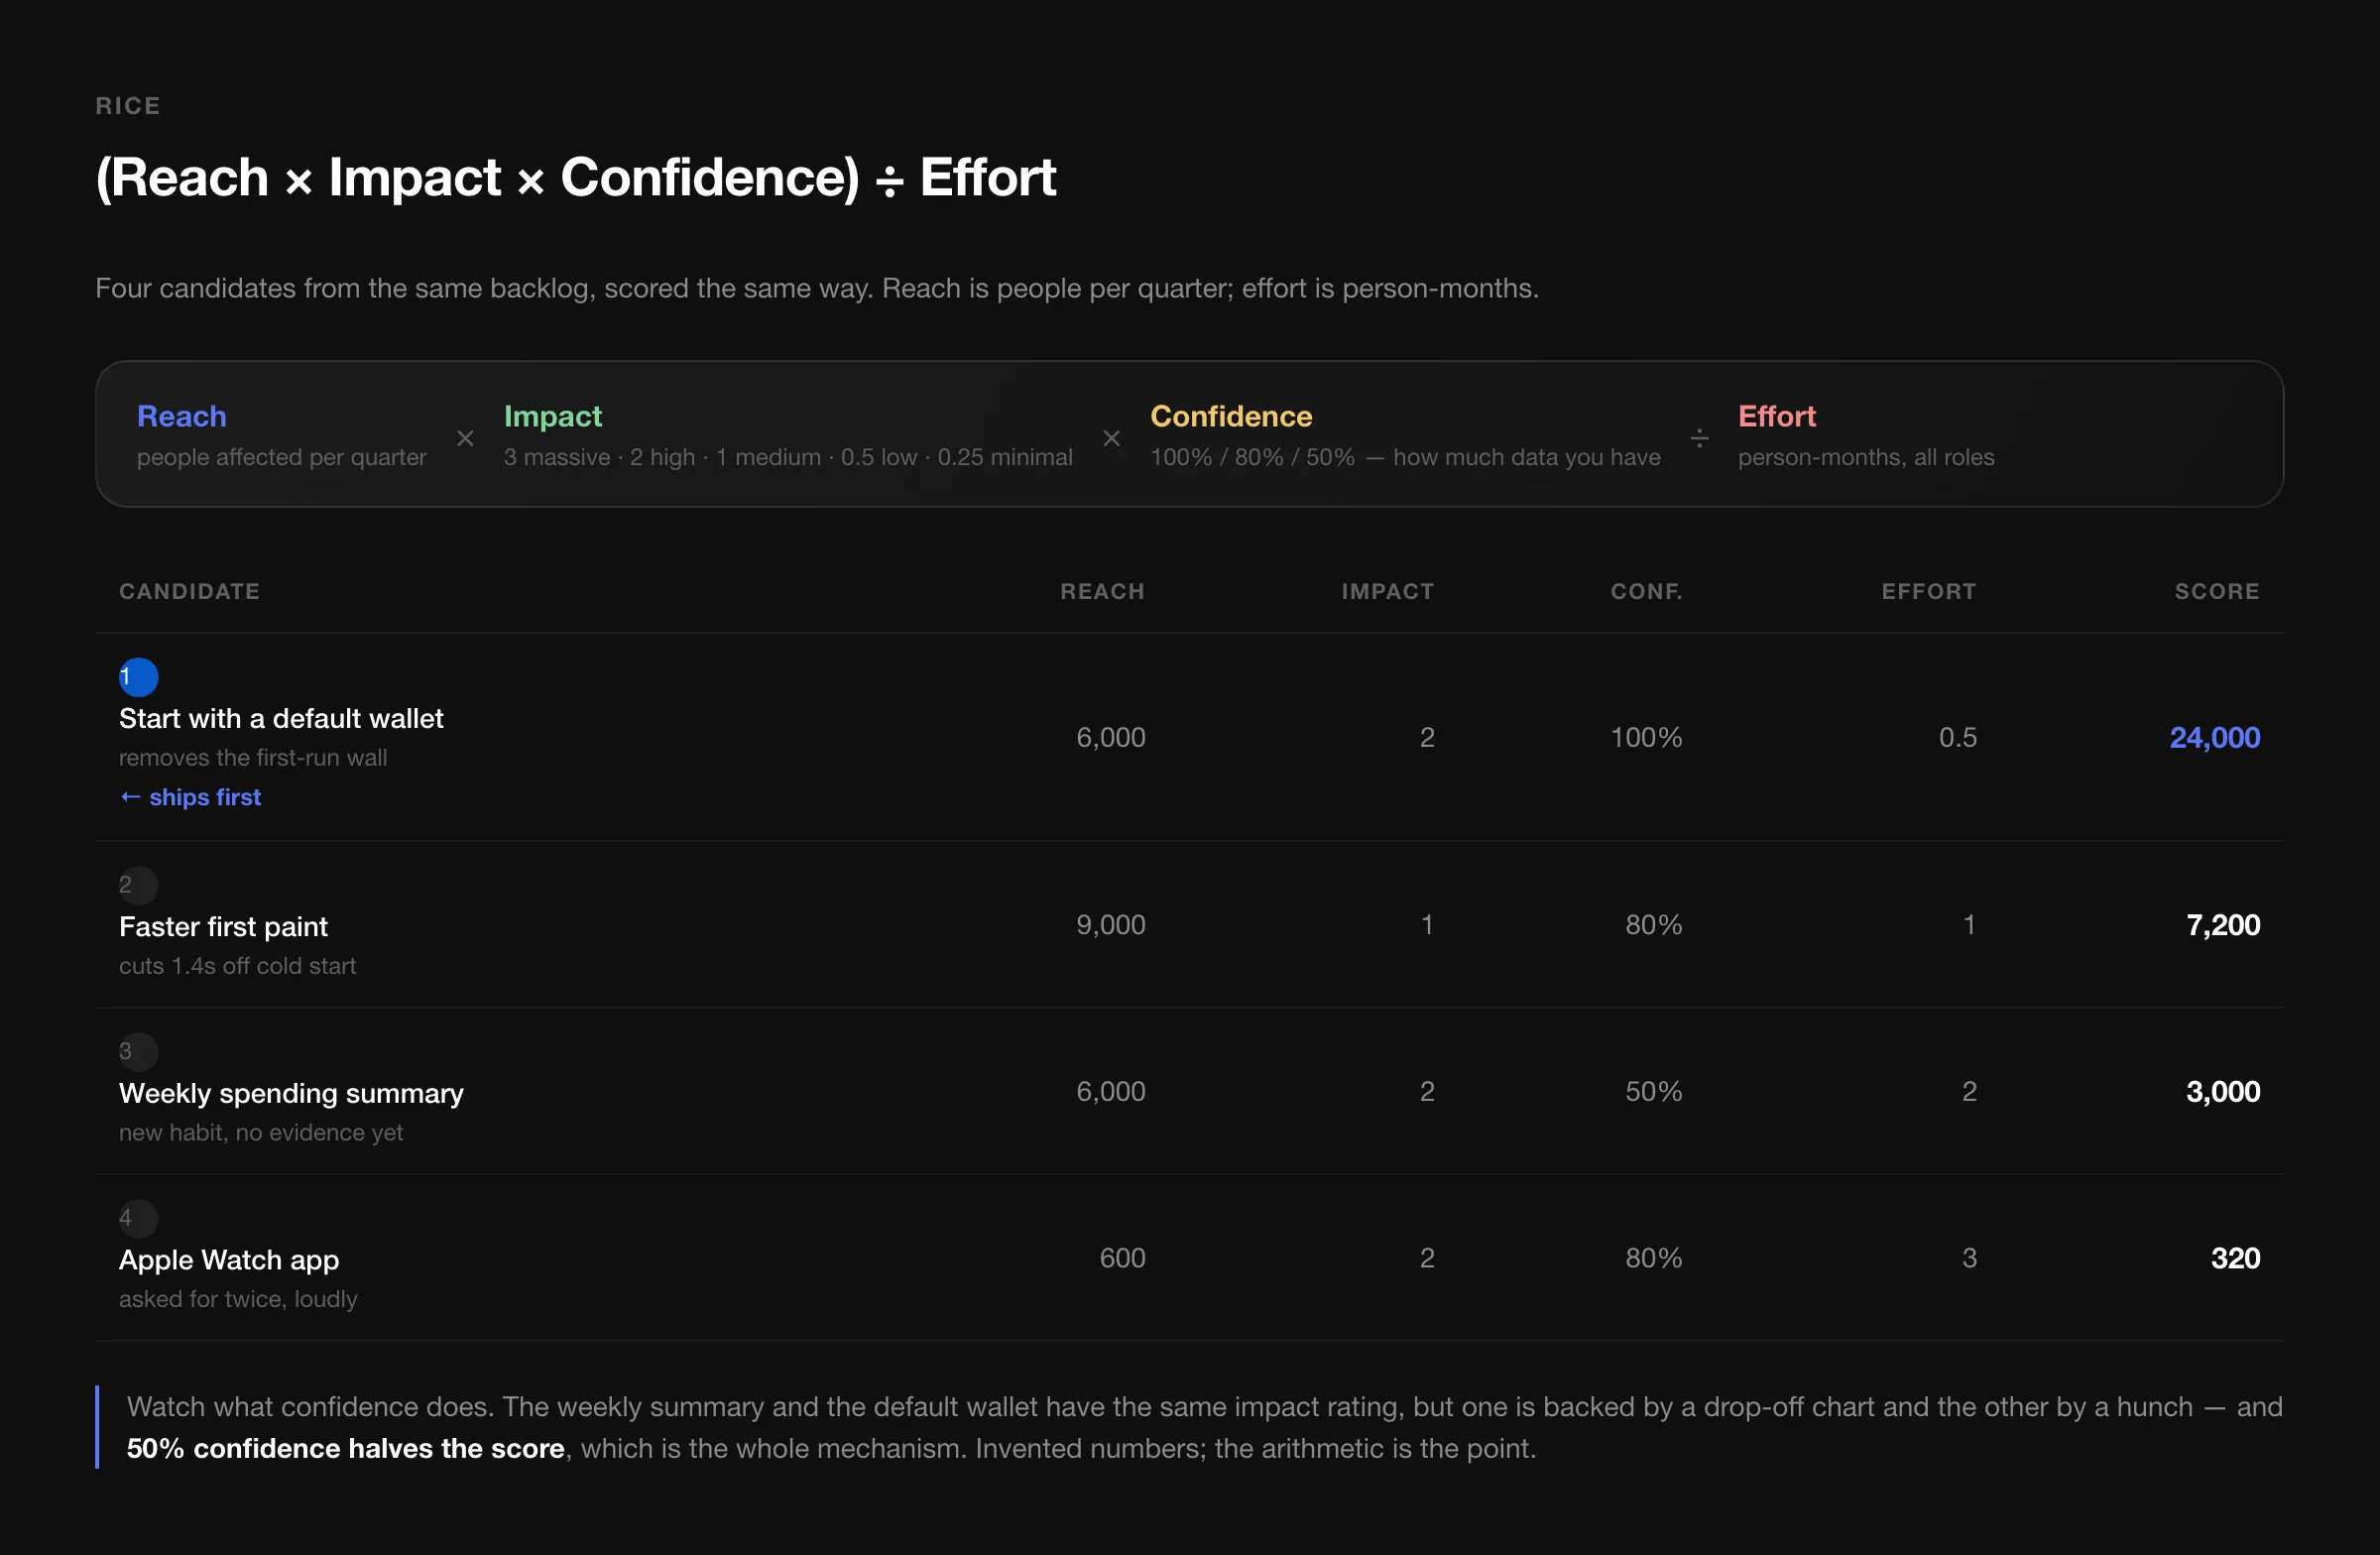
Each term does a specific job:
- Reach — how many people this touches in a fixed period. Pick one period and never change it, or the scores stop being comparable.
- Impact — how much it matters to each one, on a deliberately coarse scale: 3 massive, 2 high, 1 medium, 0.5 low, 0.25 minimal. The coarseness is a feature; arguing between 2 and 2.5 is not analysis.
- Confidence — how much evidence is behind the other two, as a percentage. This is the term that keeps the formula honest.
- Effort — person-months across every role involved, not developer days.
Watch what confidence does in the example. The weekly summary and the default wallet get the same impact rating, but one is backed by a drop-off chart and the other by a hunch, and 50% confidence halves the score. That is the whole mechanism: it prices uncertainty instead of arguing about it, and it gives a researcher something concrete to do — raise the confidence, and the item moves up on its own.
The Apple Watch app is the instructive row. It was asked for twice, loudly, by people whose opinion is worth hearing. It reaches 600 of 9,000 users and costs three person-months. The score says it finishes last, and the score is right — but the number is not what makes that decision survivable. What makes it survivable is that the reasoning is written down in a form the person who asked can inspect, and disagree with, line by line.
Big bets get the long form
For anything in the big-bet quadrant, a score is not enough. My note points at the 5C analysis for these, which is a prompt list more than a framework:
| C | What to write down |
|---|---|
| Company | Our products, our real advantages, the goals this serves, what it does to the brand. |
| Collaborators | Partners, suppliers, distributors, anyone whose cooperation this assumes. |
| Customers | Who exactly, what motivates them, how we reach them, how they see us today. |
| Competitors | Established and emerging, their strengths, their likely response, the gaps they cannot close. |
| Climate | Regulation, social and economic shifts, technology that makes this newly possible — or newly pointless. |
Climate is the row that saves projects. Half the big bets I have seen fail were not beaten by a competitor; they were made irrelevant by a platform change or a rule change that was visible a year earlier to anyone who looked.
Where scoring goes wrong
Three failure modes, all of which I have caused:
Treating the score as the decision. It sorts the list; it does not sign off the quarter. Strategy regularly beats arithmetic — sometimes you build the thing with the lower score because it is the first step towards something that only pays off later.
Comparing scores built on different assumptions. If one person counted reach per quarter and another per month, the table is nonsense. Agree the units first, in writing.
Letting people score their own ideas. Effort estimates drift downwards and impact estimates drift upwards whenever the scorer is also the advocate. Score in pairs, with one person who did not propose the item.
The real output of any of these methods is not a ranked list. It is a sentence you can say out loud when somebody asks why their request is not being built this quarter — and a sentence that holds up is worth more than any ranking.