
Metrics you can actually move
Four tests for a number worth keeping, the HEART and AARRR frameworks filled in with real examples, leading versus lagging, and the cohort table that explains why a good release can look like a bad one.
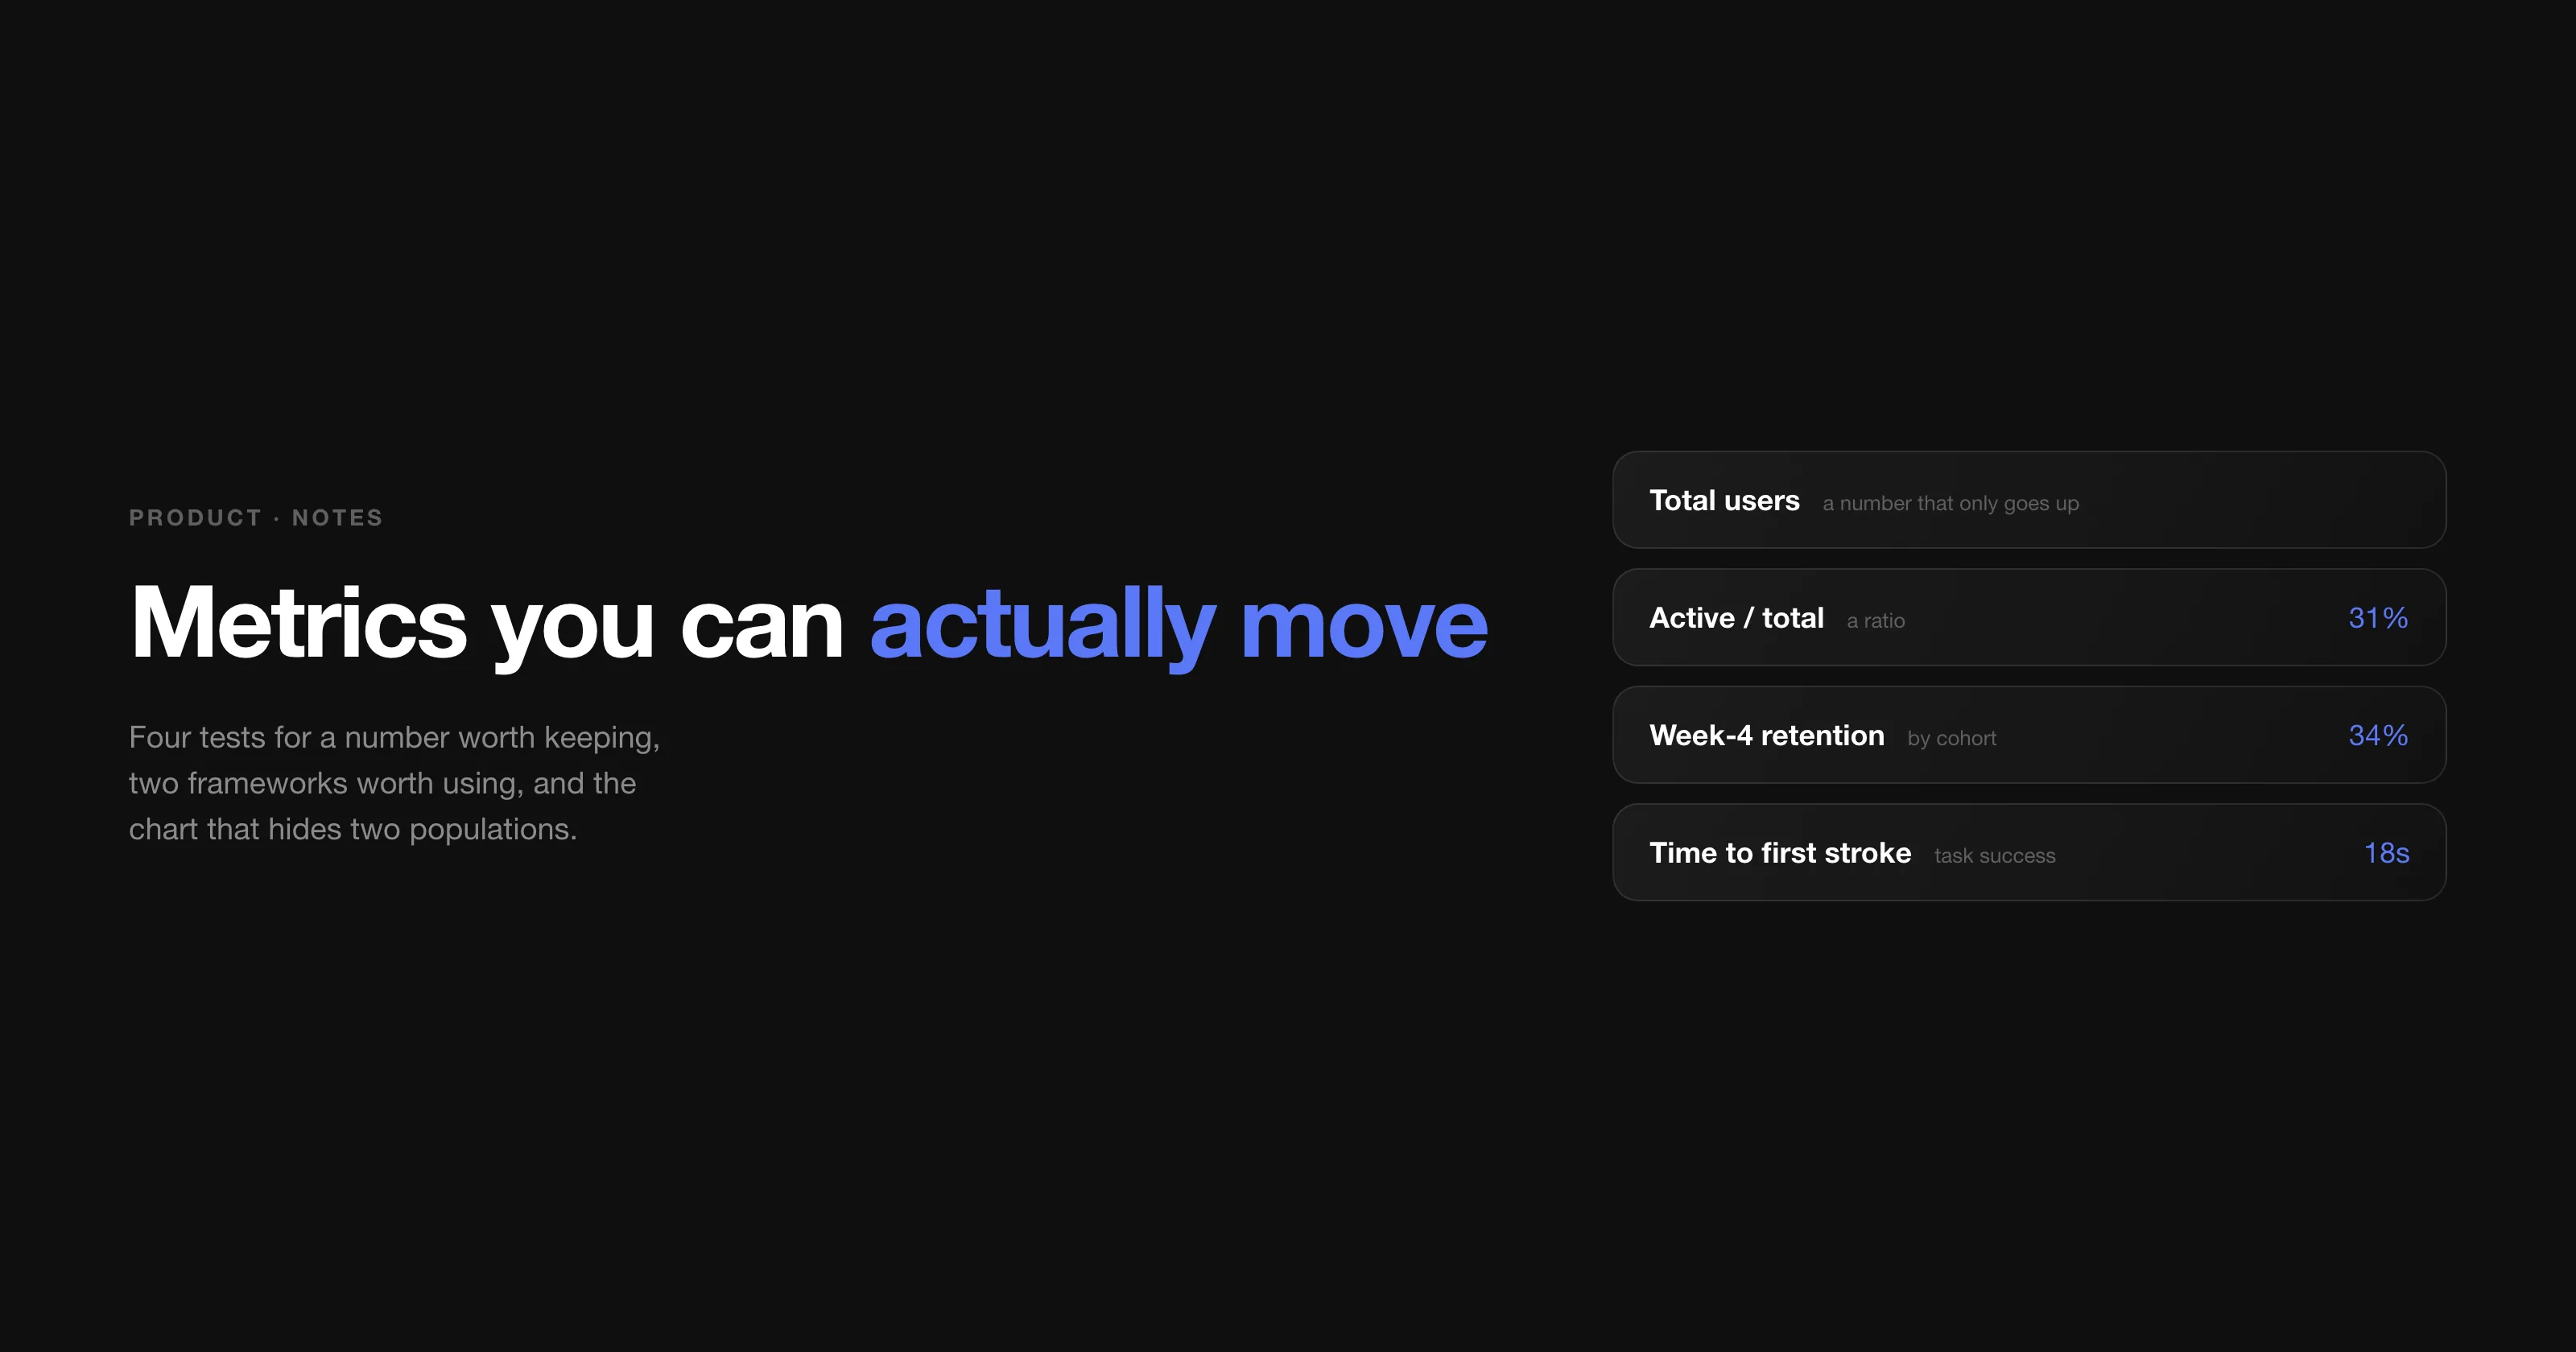
Nobody has a shortage of numbers. Every product I have worked on could produce a dashboard within a day, and most of those dashboards changed nothing — people looked at them in the Monday meeting, agreed that the line was going up, and went back to building whatever they were already building.
The notes I kept on this from 2021 are mostly lists of metric names. The part that turned out to matter is much shorter: four tests for whether a number deserves to be on the wall at all.
Four tests for a metric worth keeping
1. You can explain it in one sentence. If a number needs a paragraph of caveats, nobody will act on it. "How many people clicked this button twice" is a real thing you can count and a useless thing to know.
2. It is a rate, not a raw count. Total registered users only goes up, which makes it comforting and uninformative. Active users divided by total users goes both ways, and so tells you something. Almost every vanity metric is a count, and almost every useful one is a count divided by another count.
3. It actually correlates with what you care about. Two lines moving together is not a relationship. Time-in-app is the classic trap: it rises when people love the product and it also rises when they cannot find anything, and nothing in the chart distinguishes the two.
4. You can move it. This is the test people skip. If your product is one where 90% of customers buy once a month — because that is how often they need the thing — then "purchases per customer per month" is a number you will spend a year failing to shift. Basket size per purchase is a sibling metric you can genuinely influence. Choosing the movable one is not lowering the bar; it is the difference between a goal and a wish.
| Instead of | Keep | Because |
|---|---|---|
| Total users | Active users / total users | The first can only rise, even while the product dies. |
| Downloads | Installs that finish setup | A download that never opens is a marketing number. |
| Time in app | Time to the thing they came for | Long sessions can mean delight or confusion. |
| Total revenue | Revenue per active customer | Separates "more people" from "better product". |
| Support tickets | Tickets per 1,000 active users | Growing products get more tickets by default. |
The families, and the question each one answers
My note grouped metrics into five families, and the grouping has held up: growth and activation (how many arrive, and how many become real users), engagement (how much they use it this week), retention (how many are still here next month, plus the resurrected ones who came back after a nudge), happiness (ratings, NPS, complaints), and revenue (LTV, CAC, MRR).
The two worth stating plainly, because they are the ones that decide whether a business works:
- LTV — what one customer is worth over the whole relationship.
- CAC — what it costs to get one, including salaries, not just ad spend.
If LTV is not comfortably larger than CAC, no amount of growth helps: each new customer makes the hole bigger. That single comparison has killed more plans in my experience than any product decision.
HEART: pick the goal before the number
Google's HEART framework is the one I keep coming back to, not because the five dimensions are special, but because of the order it forces: goal, then signal, then metric. Teams almost always start at the metric, which is how you end up measuring whatever your analytics tool happened to make easy.
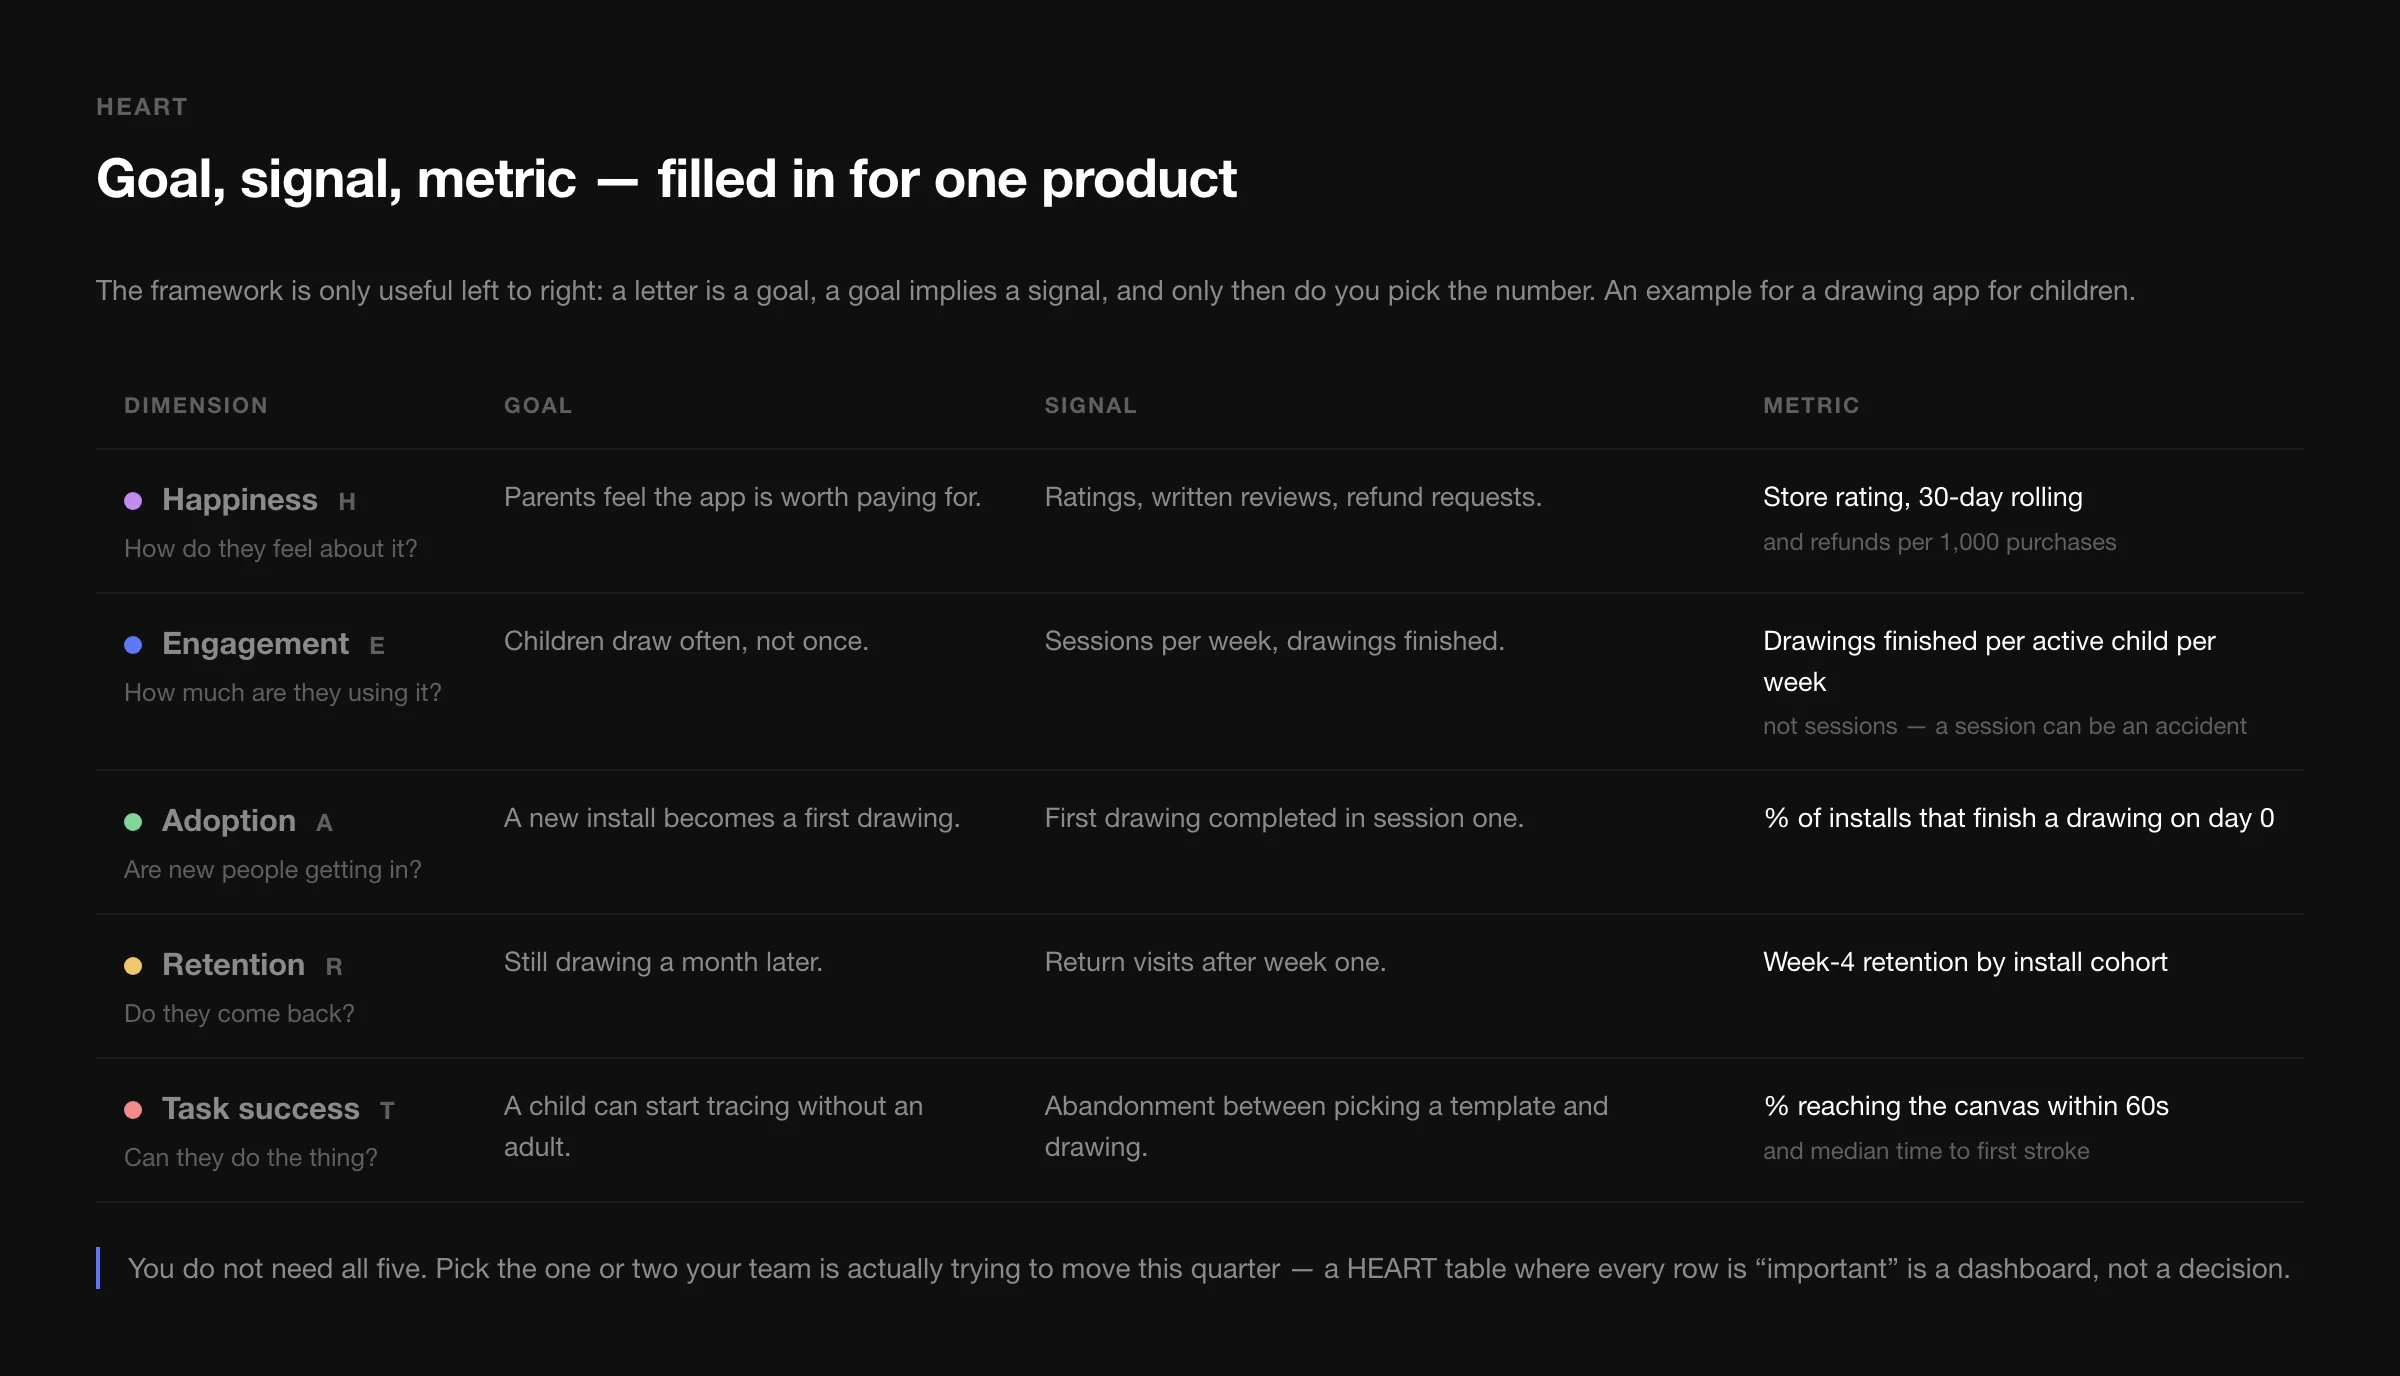
Two notes from using it. First, the signal column is where the thinking happens — "children draw often" is a goal, "drawings finished per active child per week" is a metric, and the step between them is where you decide what "often" means. Second, you do not need all five rows. A table with five equally important dimensions is a dashboard again. Pick the one or two you are trying to move this quarter.
AARRR: the funnel tells you what to stop looking at
Acquisition, activation, retention, referral, revenue. The value of the pirate funnel is not the five words, it is that writing the numbers as percentages of the step above makes it obvious which step is the constraint.
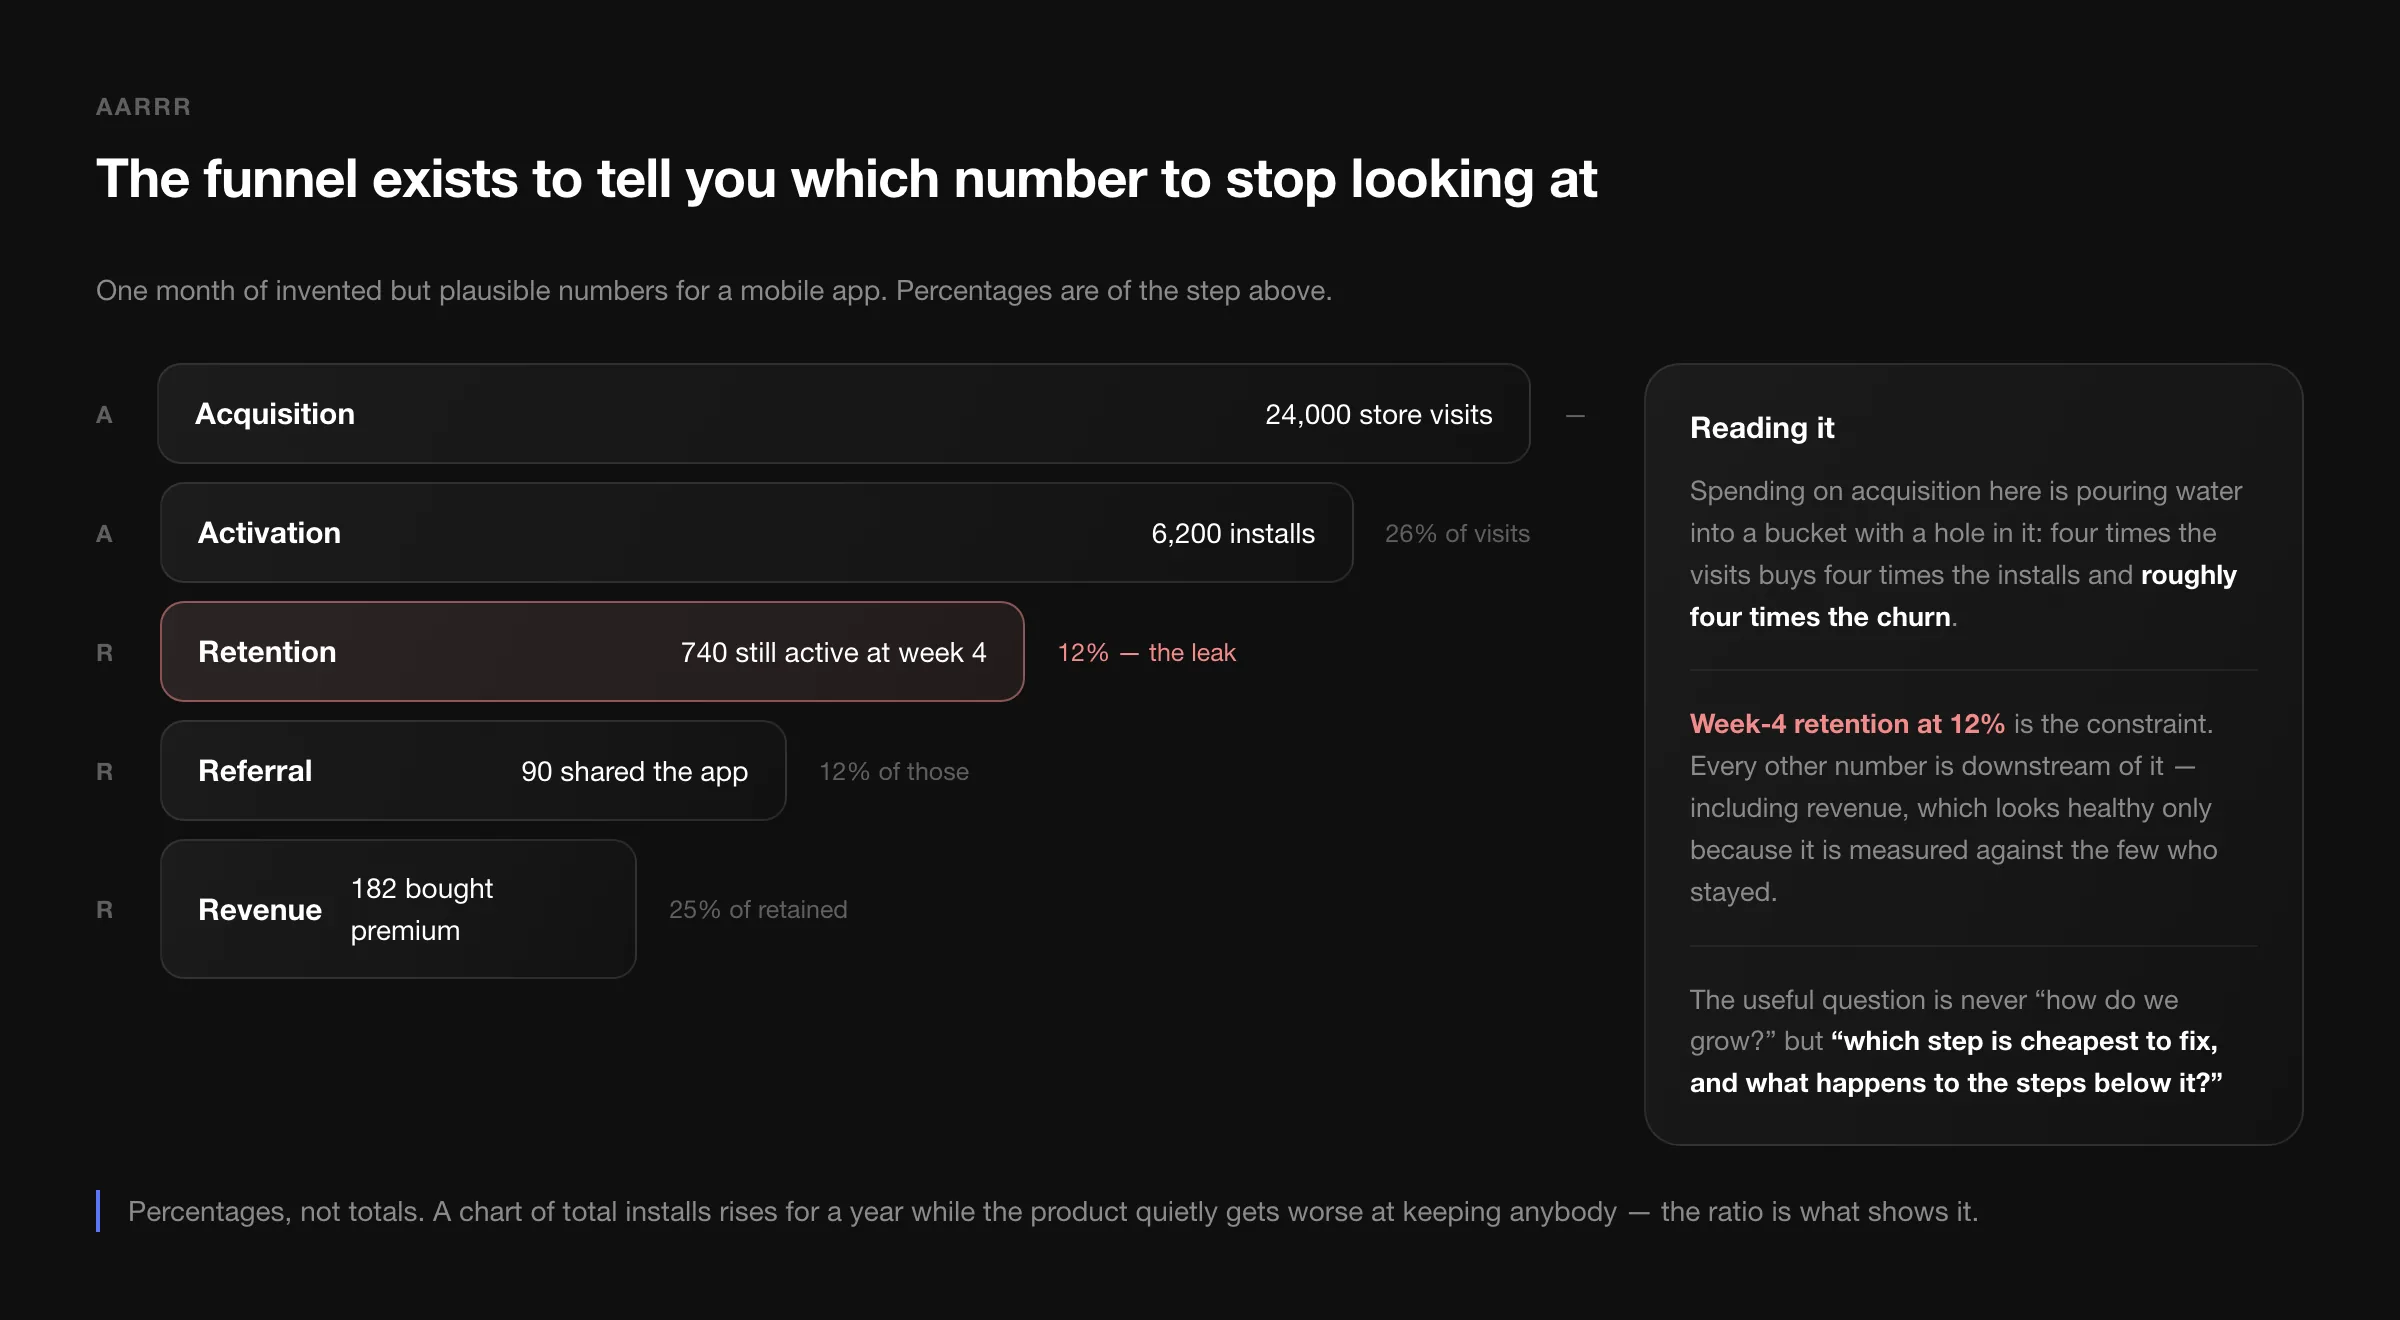
In the example, the instinct is to spend more on acquisition, because that is the lever with an invoice attached. But at 12% week-4 retention, four times the traffic buys four times the churn. The constraint is retention, everything below it is downstream, and revenue only looks respectable because it is measured against the handful of people who stayed.
Leading and lagging
The distinction my note made with a weight-loss example is still the clearest version. Your weight is a lagging metric: it reports the past and you cannot act on it directly. Calories eaten and calories burned are leading metrics: change them, and the lagging one follows weeks later.
Products work the same way. Revenue and retention are lagging — they are the scoreboard. Time to first value, number of accounts connected in week one, support response time: those are leading, and they are the only things a team can act on this sprint. Set targets on lagging metrics, run the week on leading ones.
Cohorts: the average hides two populations
The single most useful analysis in the whole note, and the one most often skipped, is to stop looking at everybody at once.
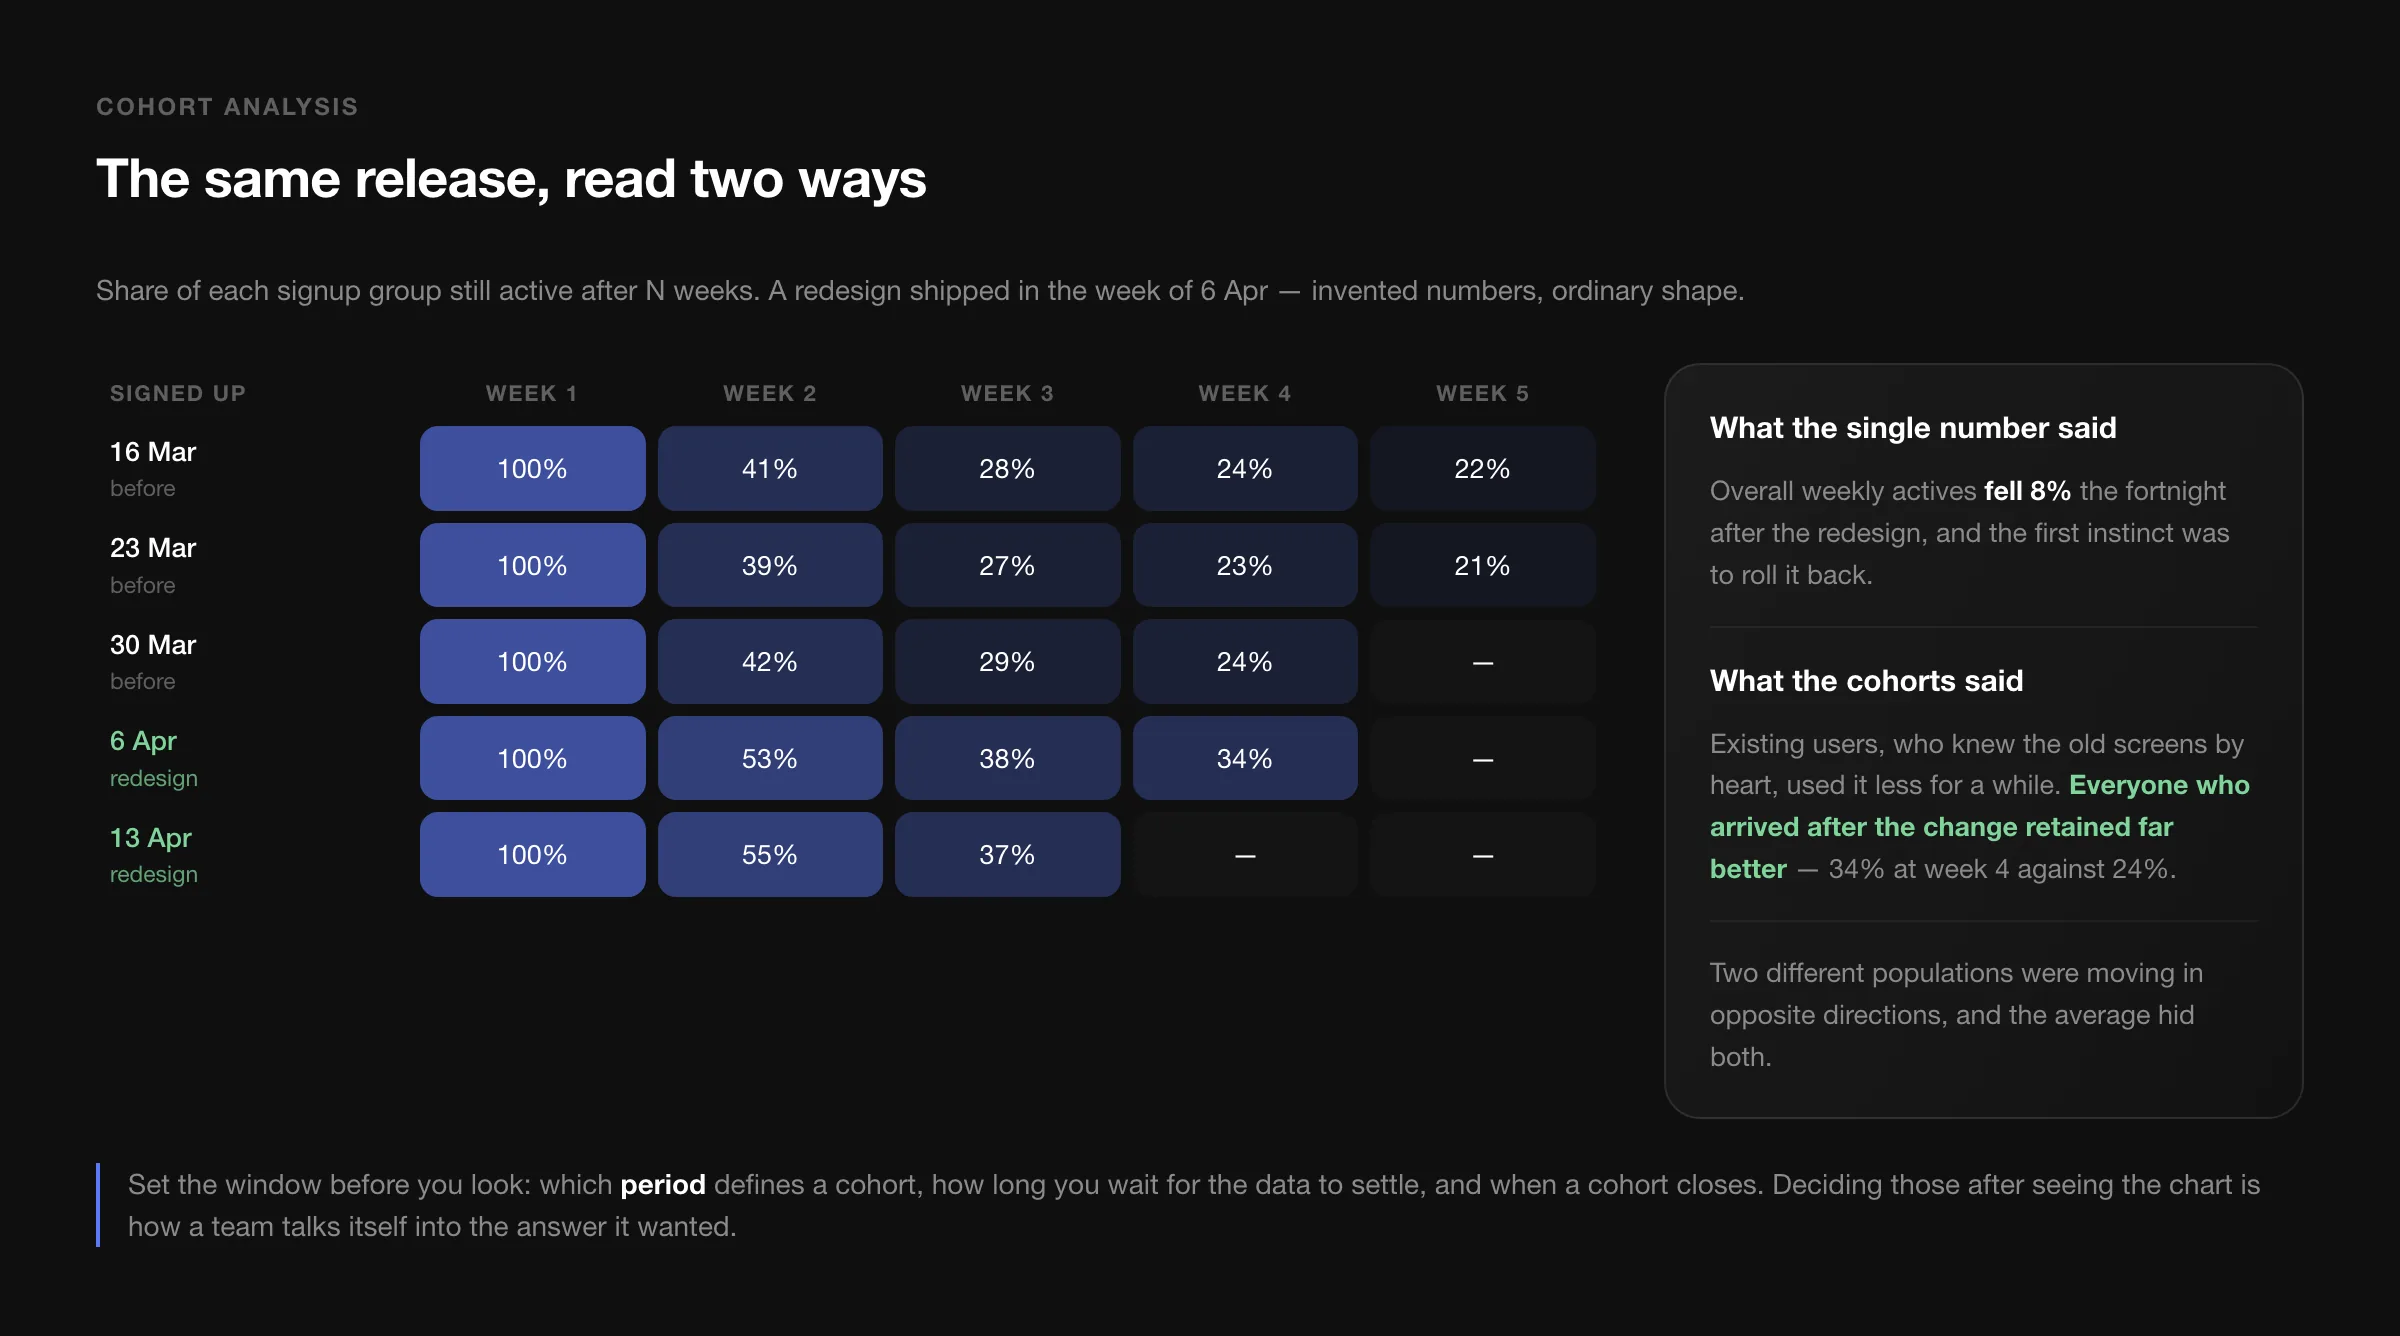
A cohort is just a group of users bucketed by when they first arrived, and the reason it matters is that people behave differently depending on when they joined. Ship a redesign and your existing users — who knew the old screens by heart — get slower and grumpier for a few weeks. New users, who never saw the old version, do better from day one. The overall number falls, and if that is all you look at, you roll back an improvement.
Three parameters are worth fixing before you look at the chart, because deciding them afterwards is how a team talks itself into the answer it already wanted:
- The period that defines a cohort — a day, a week, a release.
- The lag before you count data as stable. If events trickle in for a week, day one is not day one.
- The close — when a cohort stops accepting members.
Tools, five years on
My 2021 list has aged, so here is the current one. Pick one of each row; owning five analytics tools is how you end up trusting none of them.
| Job | Tools | Note |
|---|---|---|
| Web analytics | GA4, Plausible, Fathom | Universal Analytics is gone; GA4 is a different model, not a new skin. |
| Product analytics | Mixpanel, Amplitude, PostHog | KISSmetrics, which my note recommended, is no longer a going concern. |
| Session and heatmaps | Hotjar, Crazy Egg, PostHog | Watch ten sessions before you argue about a funnel. |
| Experiments | Optimizely, GrowthBook, PostHog | Only worth it once you have the traffic to reach significance. |
| Event routing | Segment, RudderStack | Define the event names once, in one place, and version them. |
One warning that is more relevant than it was in 2021: a large share of mobile and browser traffic now blocks third-party analytics outright. Whatever your dashboard says, the real number is bigger, and the gap is not evenly distributed across your users. Treat analytics as a sample with a bias, not as a census.
The test that matters
Before adding a metric to a dashboard, I ask one question: if this number moves, what will we do differently on Monday? If there is no answer, the number is not a metric. It is a decoration with a chart around it, and the team will learn to scroll past it — which is worse than not having it at all.